 |
|
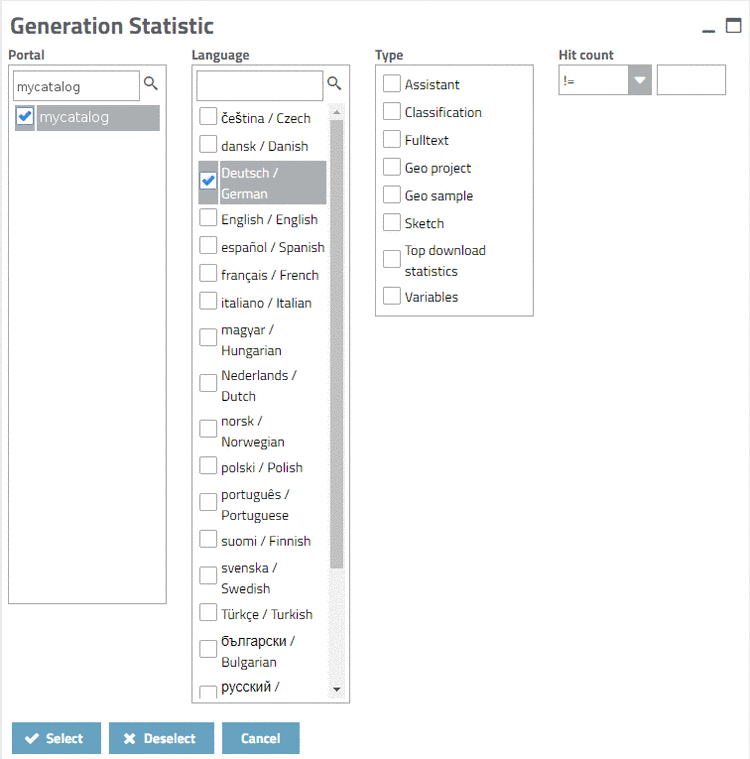
Via statistic type Search requests, you have various possibilities to analyze search requests on your portal. The most extensive possibilities are provided by an analysis in tabular form. Some often used analysis types are available in chart form.
The remaining settings under Interval and Catalogs please perform as already described underSection 1.3.3.1, “Basic settings (Generation Statistic)”.
When all settings are made, click on or .
Following filters are available:
Type: Which search mode had been used for a certain search request?
Hit count: What is the number of hit counts concerning a certain term, a certain variable?
It could be interesting for which search terms there was no hit (Hit count < 1) or which terms had been used very often.[9]
Once the desired filters are set, click on .
-> The search starts and the results are displayed.
 Table: In the result field of each column
header you can filter, meaning you can search for certain string or
substrings.
Table: In the result field of each column
header you can filter, meaning you can search for certain string or
substrings.
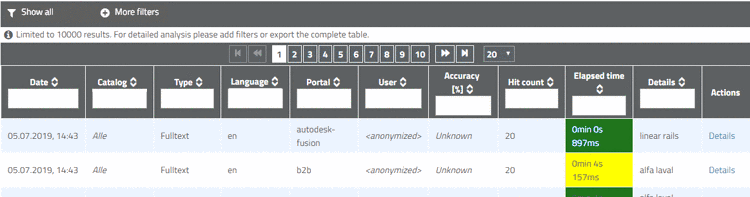
The table contains the following columns:
Language: You can filter a certain language, for example just to display terms of a certain language in the column Details.
Hit count: Number of hits with a respective search term, search part, sketch, etc.
Details: At a Full-text search the search term is displayed here, at a Variables search the search term as well, like "IDNR=12345" for example, at Geo project the path to the search part.
Actions: Display of the link Details.
At Sketch search and Geo sample search the link Export data is displayed in addition. By clicking on the link, you can export the sketches in image format or the 3D search part as STL file.
Save as template: You can save the settings for an analysis as a template (see Section 1.3.4, “Working with templates ”).
Export: You can export the table in CSV file format.(see Section 1.3.5, “Export statistic”).
[9] Optionally change the mathematical operator in the list field (!= [unequal], < [less], <= [less or equal], = [equal], < [greater], >= [greater or equal]).

![[Tip]](images/tip.png)


![[Note]](images/note.png)