 |
|
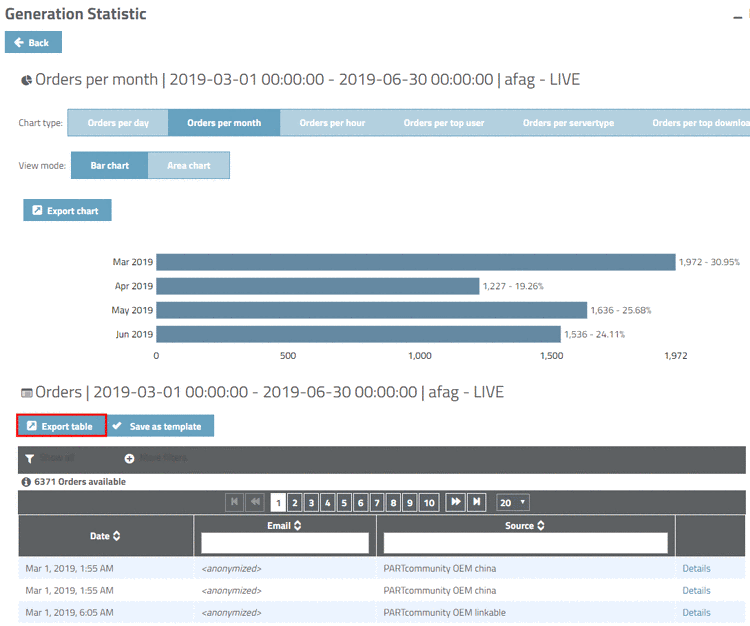
Once a query has been executed under , the button is displayed above the table.
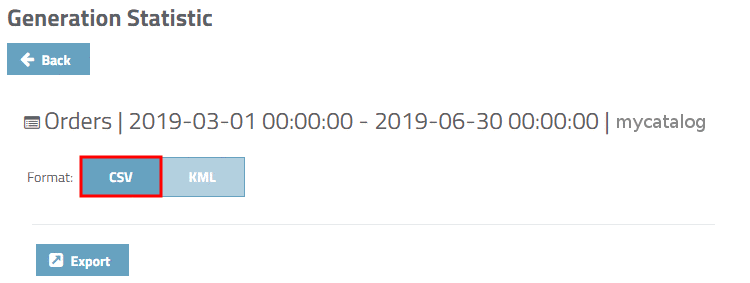
You can export your statistical data in different formats. When clicking on the button the format selection is displayed.
: For processing in Excel for example
You can enable automatic delivery by email for the CSV files. On this see Section 1.3.4, “Working with templates ”.
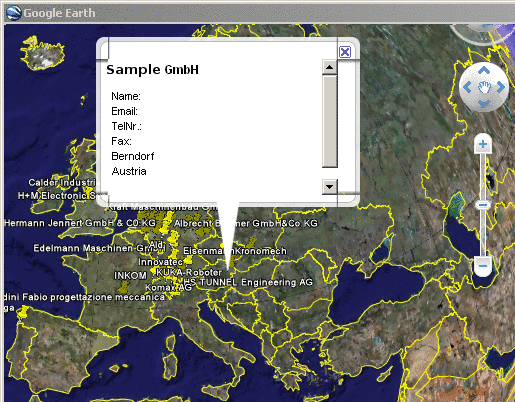
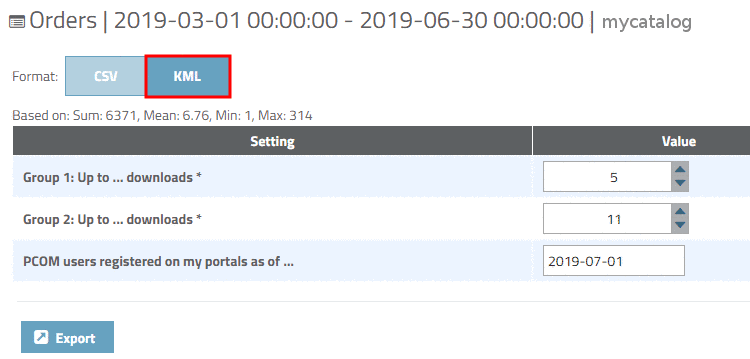
: For opening in programs such as Google Maps or Google Earth
The following describes how to export statistics:
In the Export dialog, select the option CSV or KML and click on the button.
In the case of export you can perform further specifications which result in different colors of depiction in Google Earth.
Example in following figure: Display of all users which have been registered since 1.7.2019. Those with downloads less or equal than 5 will be marked in red, up to 11 downloads in yellow and more than 11 in green.
![[Note]](images/note.png)